I have an RTX 5090 and a copy of cuBLAS. cuBLAS is what PyTorch calls when you write a @ b, and it is very good. I wanted to know how close I could get to it with kernels I wrote myself, and what I'd learn about the card on the way. So I wrote the pieces of a Llama decoder block from scratch: RMSNorm, SwiGLU, softmax, an fp32 GEMM, a bf16 tensor-core GEMM and, two days later, fused attention. Each one is a ladder. Variant 0 is the naive version. Every variant after it changes one thing, and every variant gets benchmarked and profiled, so the ladder tells you what each change bought.
The short version: the bf16 GEMM ends up ahead of cuBLAS on every shape from 2048 cubed up and at the memory floor on the decode shapes, the attention kernel is ahead of PyTorch's FlashAttention-2, the memory-bound kernels sit at the copy roof, and three things about the 5090 turned out to be different from what the spec sheet says. The first half of this post is the first run, on 2026-09-24. The second half is what two more days did to it. Code is at github.com/aidxhxr/spark-kernels.
The repo is called spark-kernels because it was going to run on a DGX Spark. The Spark hasn't arrived. The 5090 has 170 SMs, 32 GB of GDDR7 and a 96 MB L2, and it's the same consumer Blackwell family as the GB10 in the Spark, so the kernels build for both with one flag.
how things are measured
Every bench binary checks each variant against a reference before timing it. The row kernels are checked against a CPU double-precision version, the GEMMs against cuBLAS. Then it times with CUDA events, median of 100 launches after a 300 ms clock ramp, and writes a JSON line per row with the median, the minimum, and the device it ran on. A script turns those into tables and a roofline plot. PyTorch eager runs the same shapes for a second comparison.
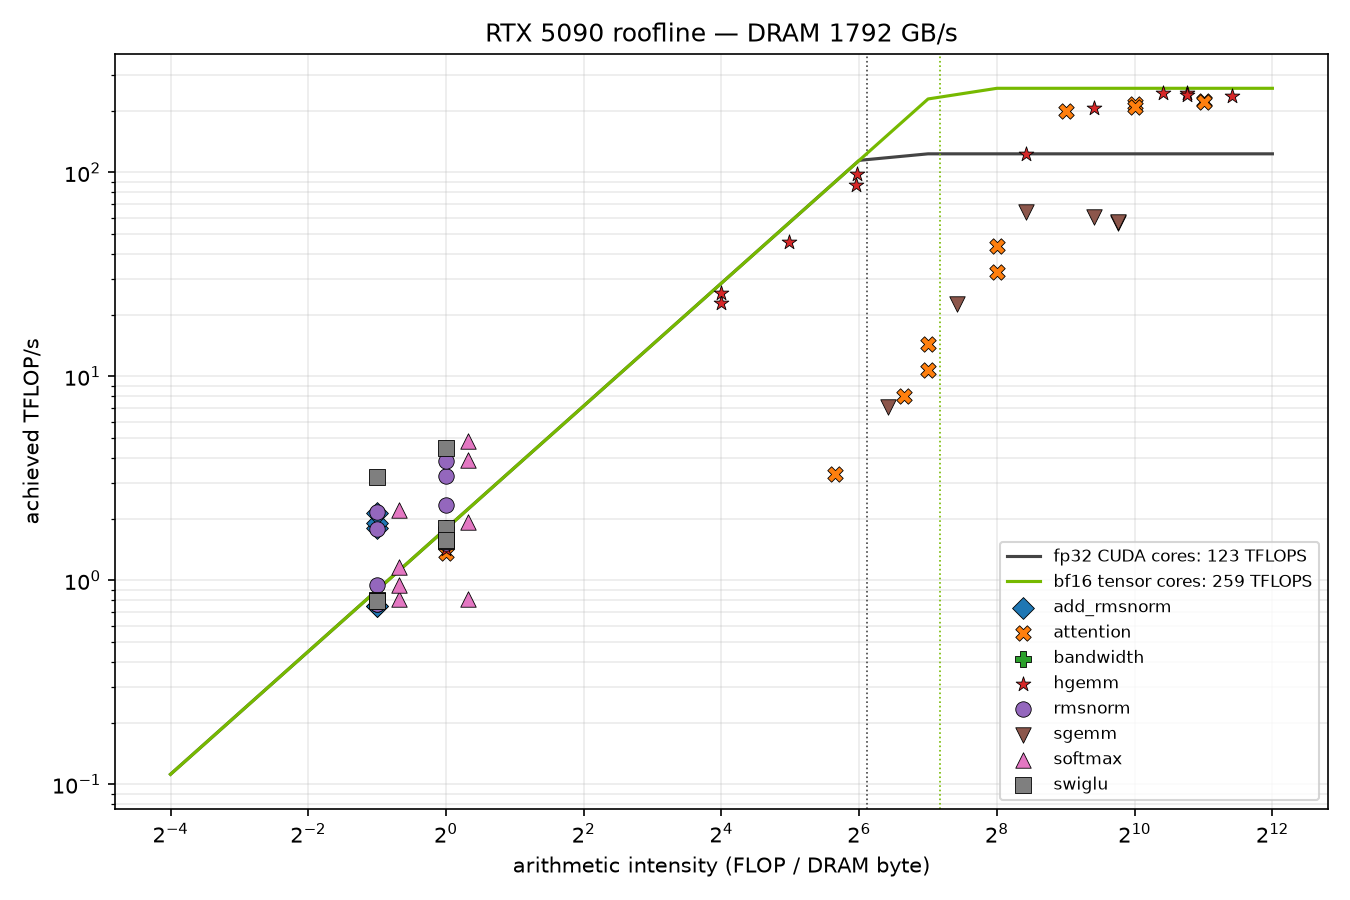
I also wrote a small bench that measures the card's actual compute peaks instead of quoting them. A loop of mma.sync.m16n8k16 on register-resident operands sustains 258.7 TFLOPS of dense bf16. A loop of independent fp32 FMA chains sustains 123.4 TFLOPS. NVIDIA publishes no dense bf16 number for this card, and the fp32 spec of 104.8 TFLOPS assumes a 2.41 GHz boost clock. The bench reads the clock during the loop with globaltimer and it's at 2,976 MHz. So the peaks the results use are measured, at the clock the card actually ran.
cudaMemcpy device to device gets 1,532 GB/s. The spec says 1,792. That 85% is the real roof for anything memory-bound, and every percentage below is against the spec, so they're a little conservative.
the bf16 gemm
This is the one that matters. A 4096 by 4096 by 4096 GEMM in bf16 with fp32 accumulation, and then the shapes a 7B model actually runs: 4096 tokens against the 11008-wide MLP weights, and decode shapes with 16 or 64 tokens.
Variant 0 is a WMMA kernel that loads fragments straight from global memory. 25 TFLOPS at 4096 cubed, 11% of cuBLAS. Variant 1 stages a 128 by 128 by 32 tile through shared memory with padding against bank conflicts: 151 TFLOPS. Variant 2 adds a two-stage cp.async pipeline so the next tile's copy is in flight while the tensor cores work on the current one: 182 TFLOPS, 81% of cuBLAS. That's where the WMMA API tops out, and it's where a lot of write-ups stop.
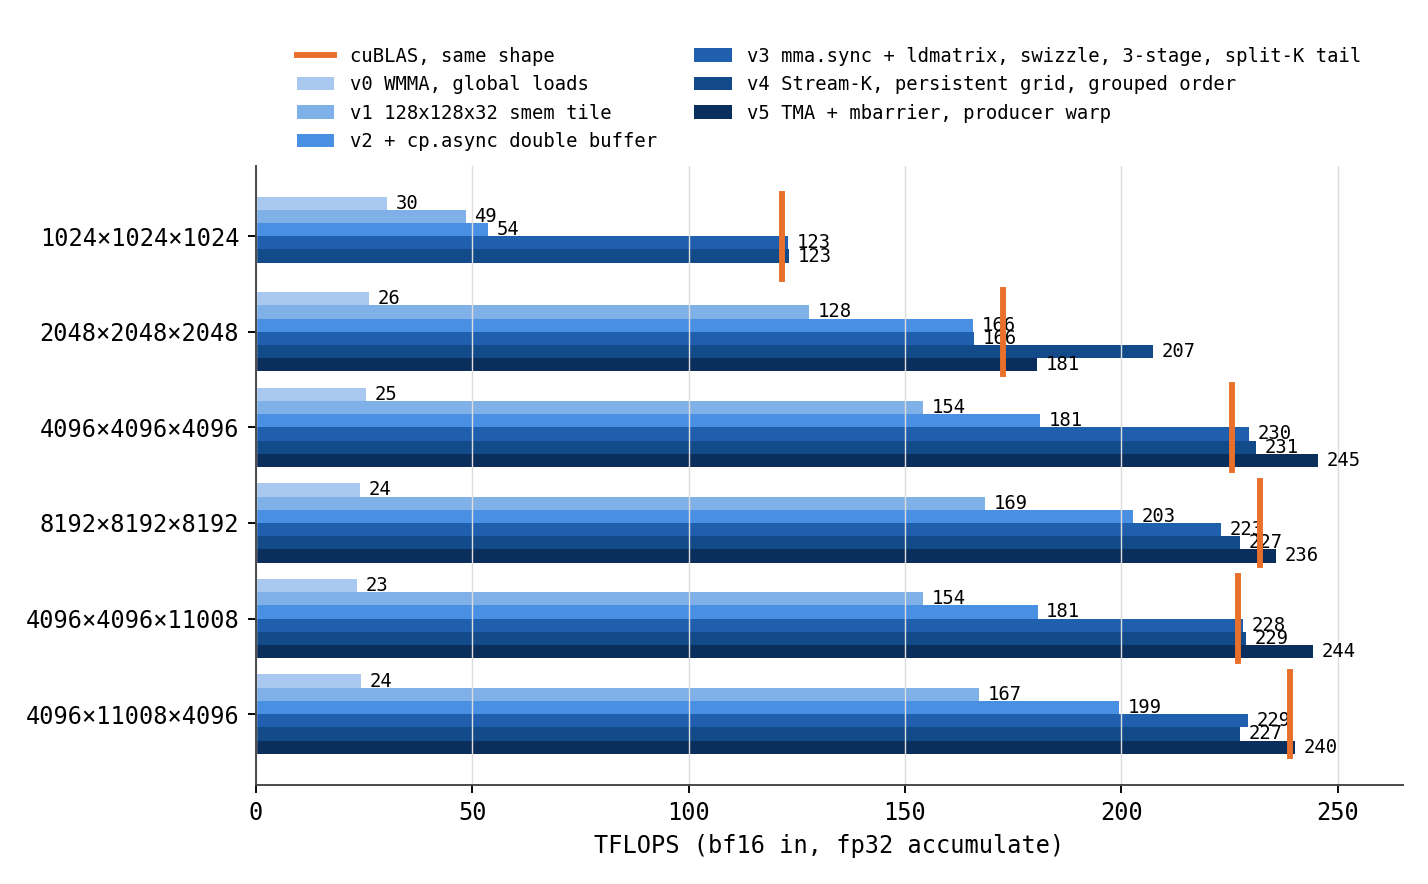
Variant 3 drops WMMA. It issues mma.sync.m16n8k16 directly and loads the fragments with ldmatrix, so the fragment layout is explicit and each warp does six shared-memory instructions per sixteen tensor-core instructions. The shared-memory tile is XOR swizzled instead of padded, which is conflict-free with no wasted bytes. The pipeline is three stages deep, in 49 KB of dynamic shared memory, so two tiles are always in flight. The epilogue writes bf16 pairs straight from the accumulator registers without going through shared memory. At 8192 cubed, Nsight Compute has the tensor pipe active 94.9% of the time, with 247 thousand bank conflicts in 403 million shared-memory wavefronts.
At 8192 cubed that got 220 TFLOPS against cuBLAS at 232. At 4096 cubed it got 200, which was only 88% of cuBLAS, and the profile said the kernel was fine. So the problem was somewhere else.
170 is 2 times 5 times 17
The 5090 has 170 SMs. Two blocks of this kernel fit per SM, so 340 blocks run at once. A 4096 by 4096 output in 128 by 128 tiles is 1,024 tiles. 1,024 over 340 is 3.01. Three full waves, then four tiles running alone on four SMs for as long as a whole wave took. A quarter of the runtime for nothing.
No power-of-two grid divides evenly into 170, so this happens on every square shape. The fix is to split the tiles of the last partial wave along K across the idle SMs. Each of those blocks accumulates a slice of K into an fp32 workspace with atomics, and whichever block finishes a tile last converts it to bf16. That's split-K on the tail only, in the spirit of Stream-K. It took 4096 cubed from 200 to 225 TFLOPS, and the 11008-wide shapes along with it. These are the first run's numbers; the second pass is further down.
| M x N x K | v3 TFLOPS | cuBLAS TFLOPS | v3 / cuBLAS |
|---|---|---|---|
| 1024 x 1024 x 1024 | 122.5 | 121.4 | 100.9% |
| 2048 x 2048 x 2048 | 166.1 | 172.5 | 96.3% |
| 4096 x 4096 x 4096 | 224.9 | 225.7 | 99.7% |
| 8192 x 8192 x 8192 | 220.4 | 232.2 | 94.9% |
| 4096 x 4096 x 11008 | 224.8 | 227.6 | 98.8% |
| 4096 x 11008 x 4096 | 224.5 | 239.4 | 93.8% |
the roof is the power limit
There's a gap left at 8192 cubed, and it isn't the kernel. I sampled nvidia-smi at 250 ms while the 8192 GEMM ran back to back. The clock starts at 2,977 MHz, hits 600 W within a second, and settles between 2,720 and 2,780 MHz with the software power cap bit set. cuBLAS does the same. So the 258.7 TFLOPS I measured is the roof for a kernel that fits in the power budget, and a real GEMM runs at 2.75 GHz, which scales the roof to about 239 TFLOPS. That is exactly the range cuBLAS lands in on the large shapes, 233 to 241. On a 5090 the tensor-core peak you can use is set by the power limit, not by the tensor cores, and the last few percent against cuBLAS are about doing the same work with fewer joules.
1024 cubed and the decode shapes
The first version of variant 3 needed M to be a multiple of 128. That excluded 1024 cubed, where it ran at 52% of cuBLAS because 64 tiles can't fill 340 slots and splitting them ten ways along K costs more than it saves. It also excluded every decode shape. When you generate a token, M is the batch size, 16 or 64 or fewer, and the GEMM is nothing but streaming the weight matrix past a sliver of activations. That's the shape an inference server spends most of its time on and the kernel couldn't launch on it.
The kernel is now templated on the tile height too. Rows past M are loaded with a zero-filling cp.async, which reads nothing and writes zeros to shared memory, so any multiple of 16 rows works. The launch picks the tile per call. If a 128 by 128 grid fills at least one wave it uses that. Otherwise 64 by 128, otherwise 64 by 64 with a deeper K step. For decode shapes it also adds a fourth pipeline stage, because at that point the kernel is a memory stream and the tensor cores are mostly idle.
One thing I got wrong the first time. My first decode numbers were 1,730 to 1,880 GB/s, which is above what GDDR7 can deliver. A 4096 by 4096 bf16 weight matrix is 32 MB, and the 96 MB L2 was keeping it between iterations, so both cuBLAS and my kernel were reading from cache. A real decode step touches every layer's weights once per token and none of them are in L2 when you get back to them. The bench now rotates through enough copies of B to exceed 256 MB, and the honest numbers are 1,160 to 1,470 GB/s for both sides. The kernel is at 97 to 104% of cuBLAS across the four shapes, and 1024 cubed went from 52% to 101%.
Those decode kernels were 30 to 60 microseconds long, and both sides were still 5 to 25% under the copy roof. That gap is the first thing the second pass went after.
the second pass
Two days after the first run I came back with a list: Stream-K proper, a decode kernel, TMA, an attention kernel, and the fp32 mystery. I ran them as five separate experiments on the same card, each in its own checkout, and merged what won. Everything below was measured on 2026-09-26 in one run of the merged tree.
the copies were the problem, not the power
I had put the last 5% at 8192 cubed down to power. Nsight showed variant 3's tensor pipe 92 to 95% active with the top stall on the pipe itself, and the card was at 600 W. What I hadn't tried was taking the copies out of the instruction stream. In variant 3 every thread computes two global addresses and two swizzled shared addresses per stage, issues two cp.async, and the whole block meets at a __syncthreads once per K tile. Consumer Blackwell has a TMA unit that does all of that from one instruction, and it isn't used by anything in the WMMA or cp.async world.
Variant 5 keeps the tile, the k-loop and the epilogue of variant 3 and changes only how a stage reaches shared memory. One producer warp issues three cp.async.bulk.tensor boxes per stage, a 128 by 64 box of A and two 64 by 64 boxes of B, against tensor maps built on the host. The copy engine generates every address and applies a 128-byte swizzle that is bit for bit the XOR pattern variant 3 computed by hand, so ldmatrix reads it the same way. Each stage has a full barrier and an empty barrier. The producer arrives on full with the byte count and the copy engine completes it; the eight consumer warps wait on full, run the tensor cores, and each arrives once on empty; the producer waits on empty before it refills. Nothing in the k-loop is a block-wide barrier.
The tensor pipe went from 92% to 99% active. Same 600 W, same 2.75 GHz, 8% more work. So it was the copies after all, or rather the barrier and the address arithmetic around them, and the power reading had fooled me because both kernels pin the cap either way.
| M x N x K | v3 | v5 TMA | cuBLAS | v5 / cuBLAS |
|---|---|---|---|---|
| 4096 x 4096 x 4096 | 229.5 | 245.4 | 225.7 | 108.7% |
| 8192 x 8192 x 8192 | 223.0 | 235.9 | 232.1 | 101.6% |
| 4096 x 4096 x 11008 | 228.2 | 244.3 | 227.1 | 107.6% |
| 4096 x 11008 x 4096 | 229.2 | 240.1 | 239.1 | 100.3% |
One bug worth telling. The two-blocks-per-SM configurations returned wrong tail tiles, and only sometimes, and never under instrumentation. The ldmatrix reads of a stage go through the generic proxy and the TMA refill comes through the async proxy, and without a fence.proxy.async before the consumer's release the refill can land before the reads are done. One fence per thread per stage fixed it. It's the kind of thing you learn from the PTX manual or from a heisenbug, and I learned it the second way.
stream-k proper
Variant 4 is the schedule I said I'd write. A persistent grid of 340 blocks, one resident set, walks the tiles in a grouped order so the ones in flight share A rows and B columns in L2. Up to two waves of tiles, or four when both operands fit in L2, the flattened (tile, k-step) space is cut into equal contiguous ranges, one per block, so there's no quantization at all. Past that, whole tiles come from a queue, so a block on a slow SM simply takes fewer, and the last wave plus the tail is handed out in K-passes of shrinking length: half a tile, a quarter, down to a dozen k-steps.
The fixup is the part I'm happiest with. Every tile that's split has one fp32 slot and a flag that says how many k-steps have been accumulated into it, with a per-launch epoch in the high word. A piece that doesn't start the tile waits until the flag reads its own start, adds the slot into its accumulators, and either publishes its end with a release store or, if it finishes the tile, writes bf16. Partials are summed in K order whichever block computed them, so the output is the same bits every run. No memset, no atomics on data, nothing cleared between launches.
Two things came out of it. 2048 cubed, 256 tiles on 340 slots, was stuck at 96% of cuBLAS because variant 3 had to drop to a 64 by 128 tile to fill the card. Stream-K keeps the big tile and spreads the k-steps: 207 TFLOPS, 120% of cuBLAS. And at 8192 cubed the grouped order took the L2 hit rate from 80% to 96% and DRAM traffic down four times, which comes back as 2% at the power limit. On the other shapes it ties variant 3. Static ranges on a multi-wave shape also exposed something I hadn't seen: with identical work, blocks on certain SM pairs finish 20% later than the rest, consistently on the same pairs. The hardware dispatcher hides that by giving slow SMs fewer blocks, which is why the queue exists.
the decode kernel
The first decode numbers were 1,160 to 1,470 GB/s against a 1,532 GB/s copy roof, on a shape that is nothing but streaming 32 MB of weights. Before touching the kernel I measured the floor: a kernel that reads 32 MB with 16-byte loads and does nothing else takes 23.6 microseconds timed the way the bench times a GEMM, one launch between two events. Back to back, 21.6. An empty launch is 1.4. Two cudaMemsetAsync in front of a kernel add 2 to 3. The old path took 27.7 microseconds and had two memsets and a kernel per call.
So the decode kernel is a separate thing now. A 16, 32 or 64-row tile picked from M, one CTA per column strip of B, the strips of a wave reading the same rows of B so DRAM sees whole rows, and no split-K. I tried split-K every way I could think of and every version measured a flat 2 microseconds over the unsplit kernel: the atomics, the fence, the counter and the last arriver's read-back are three L2 round trips the last wave can't hide. Persistent CTAs looping over work items didn't help either, because the prologue was never the cost. When N is narrow enough that there are fewer than 64 strips, K is split just enough and the last slice writes zeros back over the workspace, so a call is still one launch.
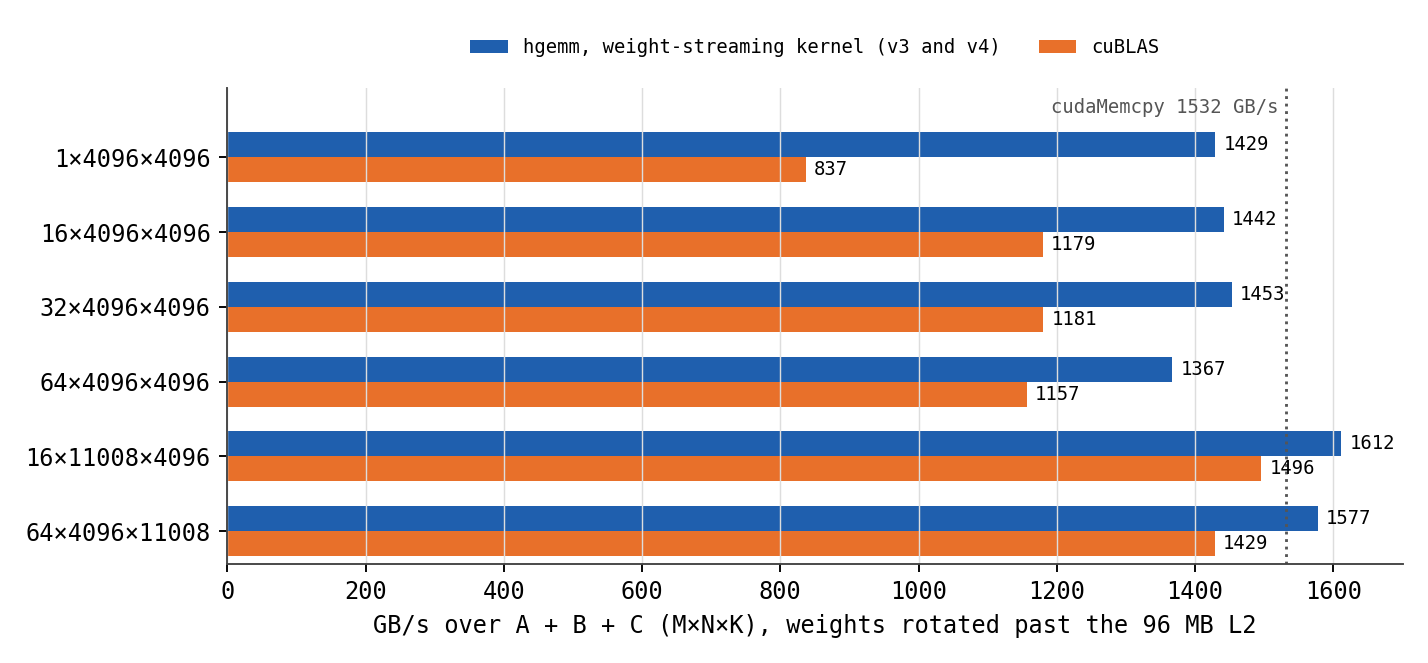
M from 1 to 64 all cost the same 23.5 microseconds on the 4096 square weights, which is the single-launch floor, and 1,570 GB/s back to back. cuBLAS takes 30, and 40 for a single token, where it uses a gemv path that's slower than its GEMM. The bytes-in-flight arithmetic was the useful part: 64 CTAs with 24 KB of B in flight each is what this card needs to reach the floor, 1.5 MB in all, and 32 CTAs top out at 1,227 GB/s no matter how deep the pipeline is.
attention
There was no attention kernel in the first run, which is a strange thing for a repo about a decoder block. Now there is.
Variant 0 is a warp per query row with an online softmax key by key. Variant 1 is flash attention on CUDA cores, a 128-row Q tile against 64-key tiles of K and V converted to fp32 in shared memory, and it hits the same wall as the fp32 GEMM: issue-bound at 49 TFLOPS. Variant 2 is the tensor-core version. Q's fragments stay in registers for the whole KV loop. S = Q K^T and O += P V are mma.sync, K is read with a plain ldmatrix because it's already the layout the B operand wants, V with the transposing one. The row max and sum live on the S accumulator fragments, a fifteen-fmax and two-shuffle reduction, and P is packed to bf16 straight from those accumulators into the layout the next mma wants for its A operand. That last part is the trick FlashAttention-2 is built on: the accumulator layout of one product is the input layout of the next if you pair the values up, so P never touches shared memory. Three-stage cp.async on K and V, causal tiles above the diagonal never loaded, heaviest Q tiles launched first.
Variant 3 is the same kernel with a schedule. Non-causal 4096 is 1,024 equal blocks on 170 SMs, 6.02 waves paid as 7, so the tail tiles are split along the keys and merged by a combine kernel, 1.41 ms to 1.22. And a query length of 64 or less gets a 64-row tile, which matters for decode: one query against a 4096-token cache went from 200 microseconds to 49, which is 1,366 GB/s of K and V streamed from DRAM, 89% of the copy roof.
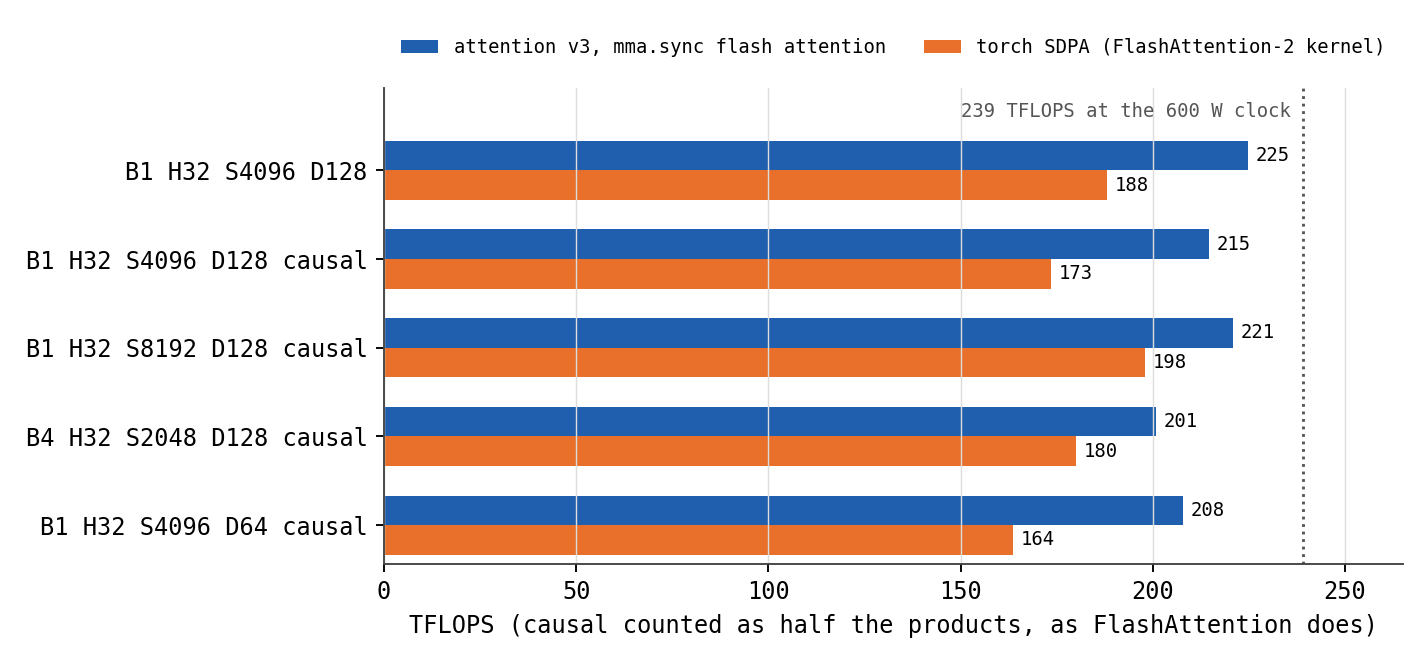
At 4096 tokens, 32 heads of 128, the causal shape runs at 215 TFLOPS by the halved count, 1.21x torch's flash kernel. Nsight has the tensor pipe 89% active with math_pipe_throttle on top; the missing tenth is the softmax between the two products, where both warps on a scheduler are between mmas. The answer to that is warp specialization, one group in its softmax while the other issues, which needs two blocks per SM or a hand-scheduled 16-warp block. Not done yet. cuDNN's attention, forced through sdpa_kernel, is 3 to 7% faster than flash on these shapes and still behind.
fp32 gemm
I expected this one to be easier and it wasn't. The best rung is at 84 to 90% of cuBLAS and cuBLAS itself is only at 54% of the measured FMA peak. The reason is shared-memory bandwidth. An SM on this part issues 128 fp32 FMAs per clock and reads 128 bytes per clock from shared memory. With an 8 by 8 register tile per thread, each FMA needs one byte from shared memory, so you're at the limit before you've done anything wrong. cuBLAS is stuck at the same wall.
Variant 3 used cp.async and lost to variant 2, because cp.async can't transpose and the A tile has to be read with strided scalar loads. Variant 4 prefetches the next tile into registers during the FMAs instead, and the transpose happens for free in the register hop. That put the transposed A stores into a 4-way bank conflict, 50 million conflicts in 489 million wavefronts, which an XOR swizzle keyed on k over 4 fixed. Capping registers at 128 so two blocks fit per SM was worth another few percent. Variant 5 goes to a 256 by 128 tile with 16 by 8 micro-tiles, which is 0.75 bytes per FMA instead of 1, and it wins on the wide shapes. Nsight says the FMA pipe is 64% active on variant 4 and the issue slot is busy 68% of the time. To go further you need something other than ld.shared, which is what cuBLAS is presumably doing.
the 11008 shapes were the clock
The first run had the 11008-wide fp32 shapes 10% slower per FLOP than 4096 cubed, and I guessed at the TLB. It's not the kernel. Nsight pins the clock while it profiles, and at that clock variant 5 does the same work per clock on every shape and comes out 2 to 6% ahead of cuBLAS. Unlocked, nvidia-smi shows the card's limiter holding a sustained fp32 FMA kernel at 1,890 MHz and 455 W, 145 W under the cap, while cuBLAS's kernel gets 2,320 MHz at 580 W. With the clock locked at 1.9 GHz the two kernels are within a few percent on every large shape, mine ahead on three of four. Whatever the limiter keys on, it's activity and not watts: 73% of the FMA pipe busy on all 170 SMs trips it, and mma.sync at 95% doesn't. 4096 cubed only looked fine because the limiter takes a few hundred milliseconds to react and a 2 ms loop is half over by then, which is also why that row's median moves 30% between runs while its minimum doesn't. Leaving a quarter of the SMs idle on purpose raises the clock by about a quarter and nets nothing. So that rung stays as it is, and the honest number is: at equal clock, 102 to 106% of cuBLAS SGEMM; at the clock this card gives fp32, 84 to 86%.
the memory-bound kernels
RMSNorm, SwiGLU and softmax move a lot of bytes and do almost no math. The only question is whether you touch each byte once.
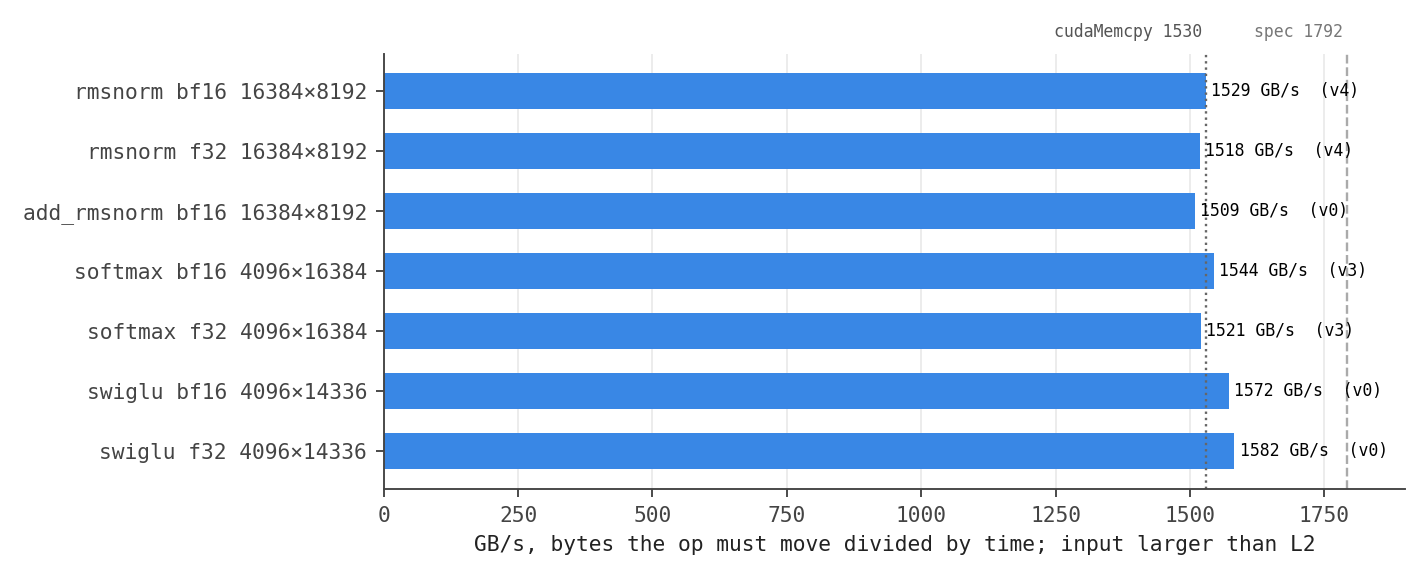
The ladders here are the usual ones. Thread per row, then warp per row with a shuffle reduction, then 128-bit loads, then a block per row for wide rows. Each of those reads the row twice: once to get the sum of squares or the max, once to write the output. The second read comes out of L2, but it still costs L2 bandwidth and it isn't free.
The top rung of both rmsnorm and softmax keeps the row in registers. A group of 32 to 1,024 threads owns one row, the group size chosen from the row length so no thread holds more than 32 elements, and the reduction is a warp shuffle plus one shared-memory exchange between the group's warps. The row is read from DRAM once, softmax computes exp once, and the output is written once. Softmax f32 at 4096 by 16384 went from 1,104 to 1,521 GB/s. RMSNorm is at 1,529 GB/s in bf16 on a 256 MB input, which is the cudaMemcpy number. The fused residual-add plus RMSNorm is 1.24x faster than PyTorch running the two ops, and SwiGLU is 1.6x faster than F.silu(g) * u, because PyTorch's version is two kernels and mine is one.
One more thing the 96 MB L2 does to you. My original bench shapes were 4096 rows, and a 4096 by 1024 bf16 input is 8 MB. It never leaves L2 between iterations. The tables for those shapes read 2 to 4 TB/s, which is L2 bandwidth, and they're only interesting if you know that. I added a 16384 by 8192 shape so the headline row is a DRAM number for certain.
what i'd do next
A TMA producer warp on the Stream-K schedule, since variant 5 still has variant 3's tile order and an 80% L2 hit rate at 8192 cubed where variant 4 gets 96%. Warp specialization for the softmax gap in attention. CUDA graphs for the 2 microseconds a lone decode launch pays over the back-to-back rate, which is now the biggest thing between the decode GEMM and the copy roof. And a GB10 run, when the Spark arrives.
The roofline for all of it is below. The GEMMs and attention sit on the tensor-core roof. The row kernels sit on the memory line, and the ones above it are the shapes that fit in L2.
sources
- aidxhxr/spark-kernels: the kernels, benches, tests, and one design note per kernel with the Nsight numbers behind each rung.
- Stream-K: Work-centric Parallel Decomposition for Dense Matrix-Matrix Multiplication on the GPU, Osama et al., for the wave quantization framing and the schedule variant 4 is built on.
- FlashAttention-2, Dao, for the fragment-layout trick that keeps P in registers.
- The PTX ISA chapters on
cp.async.bulk.tensor,mbarrierand the proxy fences, which is where the heisenbug was explained. - CUTLASS for the
ldmatrixand swizzle conventions.